Summarize this article with
At Fingerprint, we know it’s important to understand every fraud event with speed and clarity. That’s why we’re rolling out three major improvements to your dashboard experience:
- A completely redesigned Event Details page
- A streamlined filtering interface on the Identification page
- Enhanced CSV exports with applied filters and custom email delivery
These updates make it easier than ever to explore returning visitor behavior, dive deep into Smart Signals data, and act faster on what matters most.
Explore events with more clarity and context
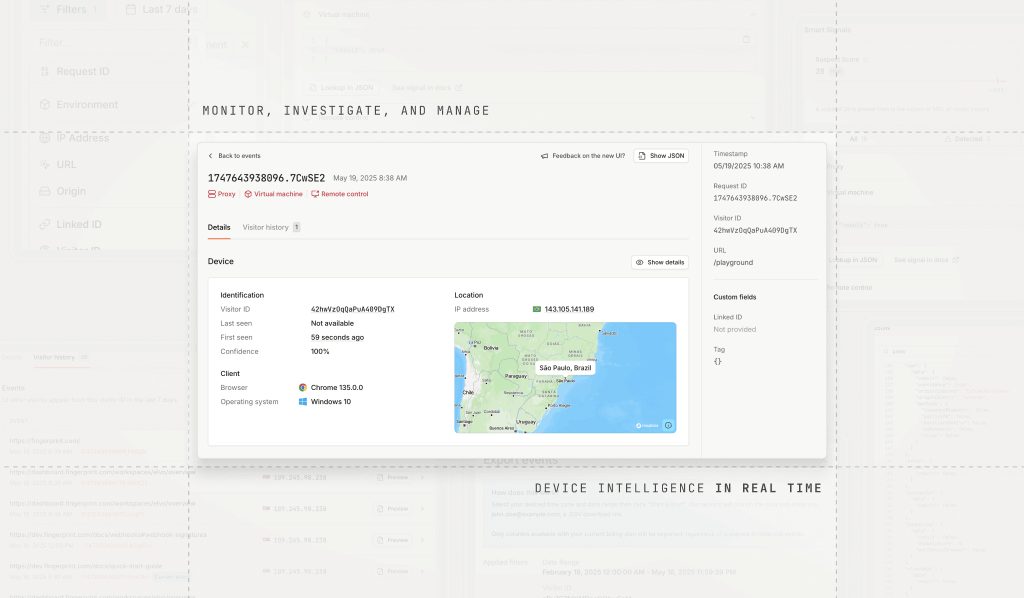
The redesigned Event Details page gives you a much clearer, more actionable view of what’s happening behind every Visitor ID.
You’ll now see immediate context like device, browser, and OS info; geolocation with a map pin; and a fully revamped Smart Signals section, featuring visual risk indicators, percentile-based Suspect Scores, and Velocity Signals — such as unusual time travel or high activity in short period — showing unusual behavior. You can also see every detected smart signal, like VPN usage or bot detection, among others.
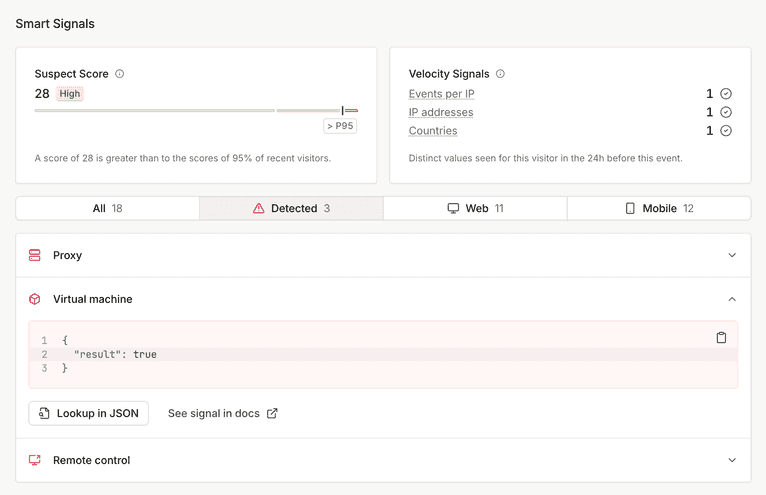
Each signal includes clear labels and intuitive visuals, making it easier to spot red flags without digging through raw data.
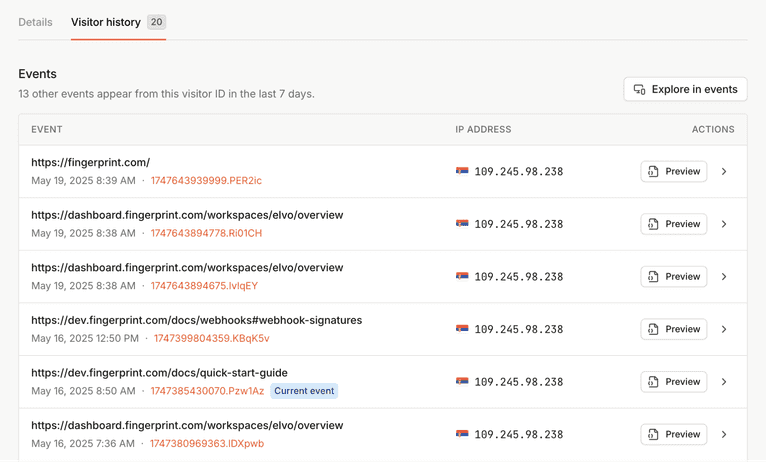
New tools like the Visitor History tab and updated JSON viewer help you follow the full visitor journey and dive straight into specific signals, without getting lost in the data.
Whether you're troubleshooting false positives, investigating fraud, or reviewing anomalies, this update gives you the clarity and control to follow the full story, faster.
Filters to fit your workflow
We’ve redesigned filtering on the Identification page to match the way you actually work.
You can now apply multiple filters in a clean, tag-based interface — perfect for narrowing in on specific attributes. Besides existing filters, we’ve added the ability to filter events by environments, allowing you to stay on top of activity on your different websites or from your clients. Also, you can link directly from an Overview chart, a Smart Signals summary, or share your exact view with teammates.
Whether you're reviewing spikes in suspicious traffic or tracking behavior in a specific environment, the new experience makes filtering faster, more flexible, and easier to use — without losing your place.
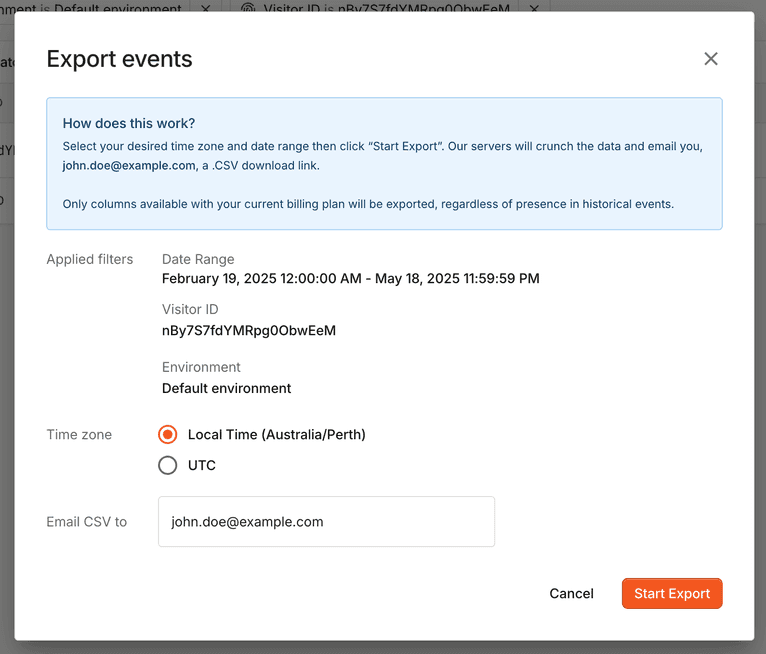
And when you're ready to take your findings offline, you can now export filtered events to CSV — complete with applied filters and a custom delivery email.
Make the most out of the new dashboard
These upgrades are designed to help you move faster, from spotting unusual activity to digging into the full picture behind an event. Here’s how to use them effectively:
- Investigate with context
The new Event Details view puts device, location, SDK, and signal data all in one place, making it easier to validate what’s risky and why. - Follow the full visitor journey
Trace multiple sessions tied to the same visitor ID using the new Visitor History tab, which helps identify repeat fraud attempts or suspicious behavior over time. - Drill down with precision
Filter by VPN, geolocation, environment, or Smart Signals to quickly surface the events that matter — without a clean, easy-to-digest UI. - Share your findings
Every filtered view is now shareable. Bookmark, link, or collaborate with teammates using the exact context you’re seeing.
About the Dashboard
The Fingerprint Dashboard is your central hub for monitoring, investigating, and managing device intelligence in real time. It brings together powerful visualizations, detailed event data, and Smart Signal insights to help fraud and risk teams quickly identify patterns, drill into anomalies, and make faster, more informed decisions. Beyond investigation, it’s also where teams manage integration setup — including API keys, webhooks, and filtering rules — making it a critical tool for both analysis and configuration.
Ready to explore the new Dashboard?
Start using the updated features today and let us know what would make your workflow even better. Share your thoughts directly from the Dashboard — we’d love your feedback!